
The Higher Ed Admissions Workforce: Pay, Diversity, Equity, and Years in Position
By Melissa Fuesting | April 2023
Introduction
Each year, the higher ed admissions workforce recruits, selects, and converts prospective students into a strong incoming class. As institutions become more reliant on tuition dollars and prepare for the looming enrollment cliff, the value of admissions employees’ specialized skillset will likely continue to grow. Without strong enrollments, colleges and universities cannot thrive.
This report provides a deep dive into the admissions workforce, with four focus areas. First, we will discuss the pay and size of admissions positions. Second, we will cover diversity and equity in the admissions workforce with attention to highlighting areas of strength and opportunities for improvement. Third, we will examine age and years in position, with a focus on low time in position for admissions coordinators and counselors. We close by suggesting next steps for colleges and universities.
Taken together, we argue that unprecedented change in higher ed provides an opportunity for colleges and universities to consider the future of admissions positions, particularly admissions coordinator and counselor positions. The data in this report highlight a need to reconceptualize key positions to encourage greater retention in roles that are essential to the future of the university. In addition, we describe opportunities for colleges and universities to work toward greater diversity and equity in the admissions workforce.
Admissions Positions by Position Level
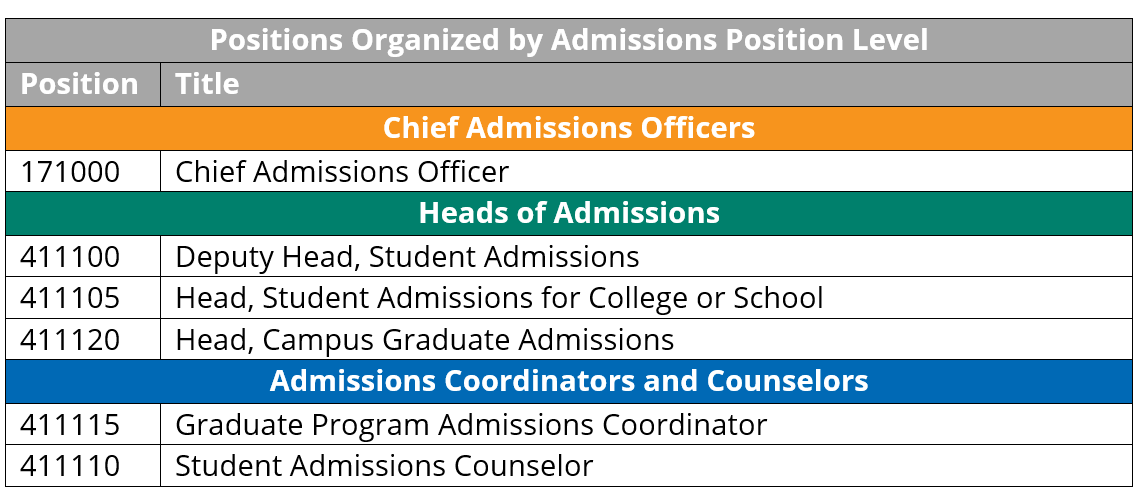
This report contains analyses of data on 12,042 admissions employees reported by 940 institutions.1All positions are collected in CUPA-HR’s Professionals in Higher Education Survey except for chief admissions officer, which is collected in the Administrators in Higher Education Survey. See our Survey Participation and Information Templates of each survey for full position descriptions. For the purposes of this report, we consider an employee as part of the admissions workforce if they are in one of six admissions positions, which we further organize into three admissions position levels (see Table 1 for position names and admissions position levels).
Chief Admissions Officers oversee institutions’ undergraduate admissions; depending on the institution, they may also lead graduate and professional student admissions.2For a detailed focus on chief admissions officers, see the recent report from American Association of Collegiate Registrars and Admissions Officers (AACRAO). Heads of Admissions are responsible for one or more areas of student admissions such as graduate admissions or admissions for a college or school (e.g., business school). Admissions Coordinators and Counselors recruit students, evaluate applications, and serve as a key point of contact between institutions and applicants throughout the admissions process.
Table 1. Positions Organized by Admissions Position Level
Pay of the Admissions Workforce
Median Salary of Admissions Positions by Classification
Figure 1 shows the median salary of the admissions workforce by position and classification.3CUPA-HR data in this report have an effective date of November 1, 2021. Median salaries overall are highest for chief admissions officers, followed by heads of admissions, and then admissions coordinators and counselors.
Median salaries differ somewhat by institution classification. Median salaries are highest at doctoral institutions with the exception of student admissions counselor. Median salaries for student admissions counselor are highest at associate’s institutions.
Figure 1. Median Salaries of Admissions Positions by Classification
Workforce Size
Median Number of Employees by Admissions Position
Figure 2 shows the median number of people per institution who hold each admissions position. Institutions have the greatest number of people in student admissions counselor positions (on median, 5 per institution).
The median number of people per position for each institution classification varies little from the overall median number of people per position. There is one exception — on median, associate’s institutions have 3 student admissions counselors, baccalaureate institutions have 4, master’s institutions have 6, and doctoral institutions have 9.
Figure 2. Median Number of Employees by Admissions Position
Representation and Pay Equity
Representation of Employees by Race/Ethnicity, Gender, and Admissions Position Level
Figure 3 shows representation by race/ethnicity and gender by admissions position level. Women are well represented at all levels of the admissions workforce. At all admissions position levels, the representation of women is higher than the representation of men within each race/ethnicity.4Admissions positions in this report typically require at least a bachelor’s degree. For this report, we compare a group’s representation within the admissions workforce to the group’s representation among bachelor’s degree holders in the U.S. to determine whether a group is well represented (same or higher representation) or underrepresented (lower representation).
Asian employees are markedly underrepresented at all levels of the admissions workforce — representation of Asian employees at each level of the admissions workforce is approximately one-third of the representation of Asian individuals among U.S. bachelor’s degree holders.5Ruggles, S., Flood, S., Goeken, R. Grover, J., Meyer, E., Pacas, J., & Sobek, M. (2020). IPUMS USA: Version 10.0 [dataset]. https://doi.org/10.18128/D010.V10.0 Hispanic or Latina/o employees are also underrepresented at all levels of the admissions workforce in comparison to U.S. bachelor’s degree holders except for among admissions coordinators and counselors. Black employees are well represented at each admissions position level in comparison to U.S. bachelor’s degree holders.
The representation of people of color notably declines from coordinators and counselors (31% people of color) to heads of admissions (23% people of color). There is also a small decline in the representation of people of color from heads of admissions (23% people of color) to chief admissions officers (21% people of color). The representation of women of color declines more than the representation of men of color from coordinators and counselors to heads of admissions. Note that declines in the representation of people of color at each successive admissions position level translates to fewer people of color in higher-paying positions (see Figure 1 for median pay and Figure 3 for representation).
Figure 3. Racial/Ethnic and Gender Representation in Admissions Roles
Median Pay Ratio by Admissions Position Level
Figure 4 shows median pay ratios by race/ethnicity and gender by admissions position level.6Median pay ratios controlled for position. Median salaries by sex and race/ethnicity for each specific position were obtained; then the median of those medians was calculated by sex and race/ethnicity for each admissions position level. This controls for the fact that groups are represented differently in specific positions that may pay higher or lower salaries, and it means that the wage gaps present are not explained by the fact that a group has greater representation in lower-paying admissions positions. Admissions employees belonging to the pictured groups are typically paid the same as or more than White men, but three exceptions emerged. Heads of admissions who are Hispanic or Latino men are paid 87 cents on the dollar to heads of admissions who are White men. Chief admissions officers who are Black women are paid 97 cents on the dollar to chief admissions officers who are White men. Finally, chief admissions officers who are White women are paid 91 cents on the dollar to chief admissions officers who are White men. Note that Black and White women comprise over half of chief admissions officers (52%; see Figure 3) and yet are paid less than White men in the same position.
Figure 4. Median Pay Ratio by Admissions Position Level
Age and Years in Position
Distribution of Employee Age by Admissions Position Level
Figure 5 shows the distribution of ages of the admissions workforce by admissions position level. Admissions coordinators and counselors (median age 30) tend to be considerably younger than heads of admissions (median age 40), chief admissions officers (median age 45), or higher ed professionals in general (median age 43). Indeed, three-quarters (76%) of admissions coordinators and counselors are under the age of 40. For context, approximately half (49%) of heads of admissions are under the age of 40, approximately one-quarter (26%) of chief admissions officers are under the age of 40, and approximately 4 in 10 higher ed professionals are under the age of 40 (44%).
Figure 5. Distribution of Employee Age by Admissions Level
Distribution of Years in Position by Admissions Position Level
Figure 6 shows the distribution of years in position by admissions position level.7CUPA-HR data on years in position assesses the number of years an incumbent has been in their position at their current institution. It is not a measure of total years of experience in the position. As expected, chief admissions officers have more years in their position (median of 4 years) than heads of admissions (median of 3 years) or coordinators and counselors (median of 2 years). Most chief admissions officers (58%) have been in their position for 5 years or less.8Our findings mirror a recent AACRAO report focusing on chief admissions officers; the AACRAO report found that 63% of chief admissions officers had been in their position for less than 5 years, and our data found that 64% of chief admissions officers had been in their position for less than 5 years. Alternatively, most heads of admissions (57%) and coordinators and counselors (71%) have been in their position for 3 years or less. Turnover is lower among chief admissions officers than other admissions positions, but a recent AACRAO report characterized turnover even among chief admissions officer positions as moderate to high.9AACRAO. (2023). 2022 U.S. Chief Admissions Officer: AACRAO Career Profile Survey Results.
We particularly wish to draw attention to the turnover among admissions coordinator and counselor positions. Turnover is considerably higher in admissions coordinator and counselor positions than positions in the CUPA-HR professionals survey overall. Most (53%) CUPA-HR professionals have been in their position for 3 years or less, whereas 71% of admissions coordinators and counselors have been in their position for 3 years or less. Short stays in coordinator and counselor positions are not a new Great Resignation phenomenon — when CUPA-HR began collecting years in position data in 2017, a similar percentage (74%) of coordinators and counselors had been in their position for 3 years or less.
Figure 6. Distribution of Years in Position by Admissions Level
Summary and Next Steps
Admissions employees play a key role in colleges and universities’ future sustainability, and even more so as the enrollment cliff approaches. However, colleges and universities have long relied on admissions positions with high turnover and young employees to do a great deal of the legwork of building institutions’ next graduating class (see Figures 5 and 6). High turnover is not a Great Resignation phenomenon — data revealed time in position for coordinators and counselors is similar in 2022 and 2017. Colleges and universities would benefit from considering how they could reconceptualize crucial admissions positions, particularly admissions coordinators and counselors, to encourage higher retention. An admissions workforce that uses their experience to gain deep insight into how to highlight their institution’s strengths may be just the edge colleges and universities need in the era of the enrollment cliff.
Efforts to increase retention among admissions coordinators and counselors should be combined with a focus on diversity. Colleges and universities should focus on recruiting Asian and Hispanic or Latina/o employees, who are underrepresented in admissions positions relative to bachelor’s degree holders in the U.S. population. Black employees are currently well represented within the admissions workforce overall in comparison to U.S. bachelor’s degree holders, but institutions should also focus on continuing to recruit Black employees. Institutions should aspire to have an admissions workforce that not just mirrors its student body, but one that mirrors the student body it anticipates or hopes to serve. Crucially, colleges and universities must also focus on retaining people of color within the admissions workforce pipeline — the representation of people of color declines from coordinators and counselors to heads of admissions.
The admissions workforce has many areas of strength in pay equity, with two notable exceptions. Heads of admissions who are Hispanic or Latino men are paid only 87 cents on the dollar to heads of admissions who are White men. Further, 52% of chief admissions officers are Black or White women, yet chief admissions officers who are Black or White women are paid less than those who are White men. A pay equity analysis that includes market rate data would help colleges and universities identify areas for improvement.
Given the findings in this report, higher education leaders should consider the following:
- How do these data compare to data at your institution? Are the years in position, diversity, and pay equity patterns similar or different?
- Does your institution have procedures in place to recruit Asian, Black, and Hispanic or Latina/o employees to the university and to admissions positions in particular?
- Does your institution have processes in place to encourage the retention of people of color in the admissions pipeline?
- Have you recently performed a pay equity analysis on your admissions workforce?
- Do you conduct exit or stay interviews? Include questions that focus on aspects of the job duties and expectations that could be altered at your institution to improve retention.
About the Author:
Melissa Fuesting, Ph.D., is a senior survey researcher at CUPA-HR.
Graphics were created by Kate Roesch, data visualization developer at CUPA-HR.
Citation for This Report:
Fuesting, Melissa. (2023, April). The Higher Ed Admissions Workforce: Pay, Diversity, Equity, and Years in Position. CUPA-HR. https://www.cupahr.org/surveys/research-briefs/the-higher-ed-admissions-workforce-april-2023/